Workforce Statistics
Current Unemployment Information
| Alabama |
DeKalb County |
|
| Civilian Labor Force | 2,293,627 | 31,244 |
| Employment | 2,234,669 | 30,466 |
| Unemployment | 58,958 | 778 |
| DeKalb's Labor Pool | 6,373 | |
| Unemplyment Rate | 2.6% | 2.5% |
Source: Alabama Department of Labor- Seasonally Adjusted. Available Labor Pool equals Underemployed plus Unemployed.
These Statistics are updated frequently. Last updated: August 2022
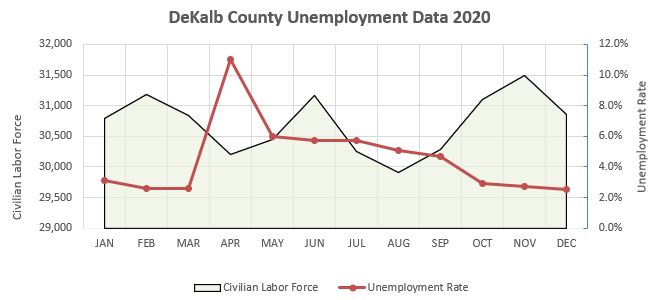
2020 Unemployment Information
Source: Alabama Department of Labor (Seasonally Adjusted)
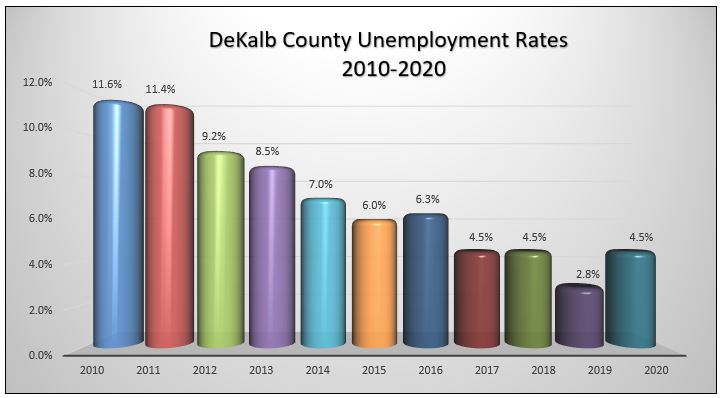
10-Year Unemployment Information
Source: Alabama Department of Labor (Seasonally Adjusted). Annual Average rates.
Current Underemployment Information
| DeKalb County |
North AL | |
| Underemployed Workers | 5,682 | 102,261 |
| Underemployment Rate 2020 | 19.2% | 19.7% |
More detailed information about our regional labor availability can be found
at these sourses.
-
Help Wanted Online Data Series™ March 2021 pdf North AlabamaWorks! Labor Demand Report
Current Labor Force Information in Surrounding counties
| County | Civilian Labor Force |
Unemployment |
Unemployment Rate |
| Jackson | 22,611 | 565 | 2.5% |
| Cherokee | 11,477 | 262 | 2.3% |
| Marshall | 44,430 | 983 | 2.2% |
| Etowah | 39,261 | 175 | 2.7% |
| Dade (GA) | 8,102 | 196 | 2.4% |
| Walker (GA) | 31,315 | 913 | 2.9% |
| Chattooga (GA) | 9,668 | 450 | 4.7% |
| Georgia | 5,161,098 | 231,990 | 4.5% |
Source: Alabama Department of Labor (Seasonally Adjusted); Georgia Department of Labor (Seasonaly Adjusted). These statistics are updated frequently.
Last updated: April 2021
Union Representation
This area is primarily a non-union pro-business community. Alabama is a “Right to Work” State.
Since 1970 there have only been three certification votes in the County and all three were defeated.
Commuting Patterns

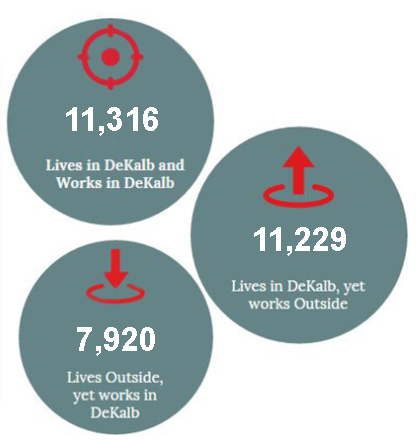
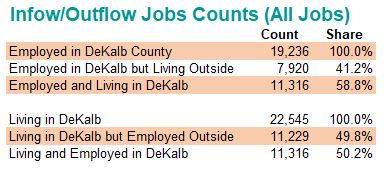
Sources: U.S. Census Bureau, OnTheMap Application and Venngage.com.


